3. Simulator Module
3.1. Launching the simulator
Follow the steps to install PyMoDAQ Femto (see Installation section)
Open a shell (for instance, Anaconda Prompt) with the correct conda environment activated
Type
simulator
3.2. Interface
The interface with default parameters is shown below. It is comprised of 3 panels:
The parameter tree
The pulse panel (with time and frequency plots)
The trace panel
Note that at first, panels 2 and 3 will be blank, you need to press the buttons Show Pulse, Show Trace, Show Both to update panel 2, 3, or both.
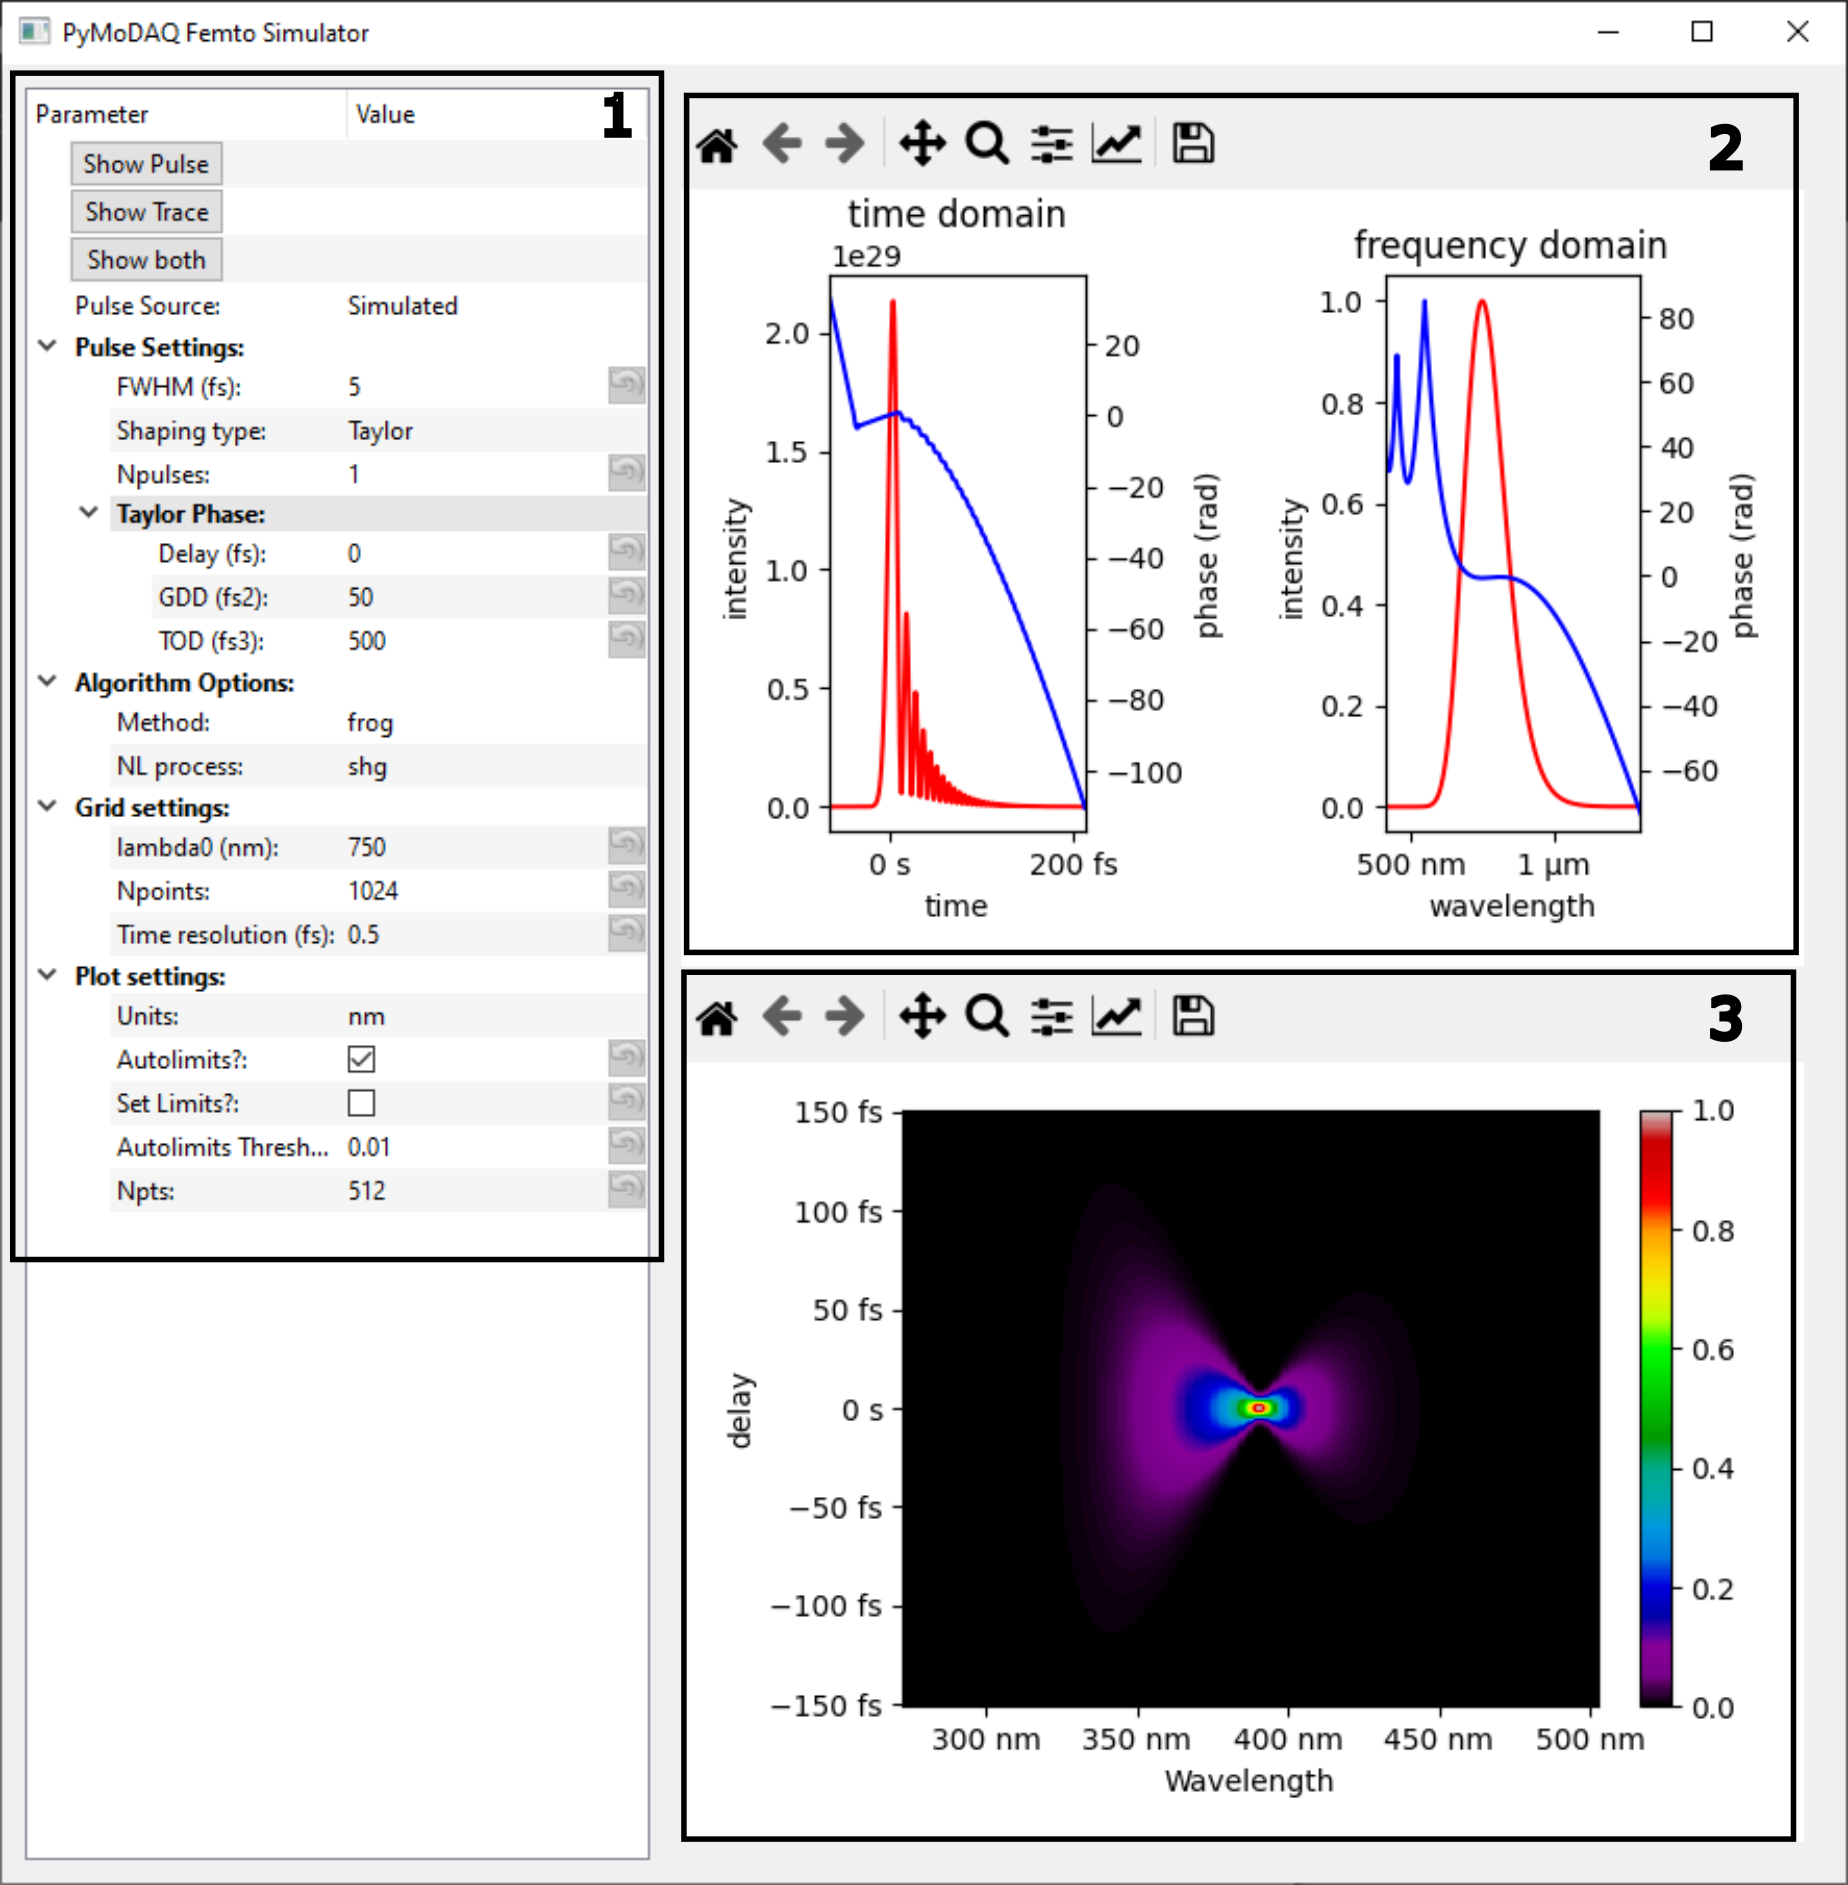
Fig. 3.1 Interface of the simulator module of PyMoDAQ-Femto with default parameters.
3.3. Description of parameters
- Show Pulse (type:
action) Updates the display of the input pulse according to the current Pulse Settings. The input pulse is displayed in a matplotlib figure, in the temporal and spectral domains. Both intensity and phase are shown for each plot.
- Show Trace (type:
action) Updates the display of the non-linear trace according to the current Algorithm Settings. The trace corresponds to the spectra generated by a non-linear process as a function of a parameter, see the pypret documentation).
- Show both (type:
action) Updates the display of both the input pulse and the non-linear trace.
- Pulse Source: (type:
list, values:SimulatedorFrom File) If set to
Simulated, the input pulse is analytically defined according to the Pulse Settings.If set to
From File, an external CSV file will be used. The CSV file must contain in columns: Wavelength (nm), Normalized Spectral Intensity and Phase in radians. A default file (spectral_data.csv) is supplied in the plugin.- Pulse Settings:
FWHM (fs):
(type: float)Temporal full width at half maximum in femtoseconds.Shaping type:
(type: list, values: Taylor or Gaussian)The phase is either defined as a Taylor series in the spectral domain, or as a Gaussian in the temporal domain.Npulses:
(type: int)Number of pulses.Pulses separation:
(type: float)Delay between the pulses, if there are more than one.Taylor Phase:
(type: group)Group delay in fs, group delay dispersion in fs2, and third order dispersion in fs3. Higher phase orders could be easily implemented if required.Gaussian Phase:
(type: group)Amplitude and full-width at half maximum of the Gaussian temporal phase.Data File:
(type: browsepath)Path to the user-supplied file if Pulse Source is set toFrom File.
- Algorithm Options:
Method:
(type: list)The type of measurement (FROG, MIIPS, etc.). See Available methods for a full list of available methods.NL process:
(type: list)The non-linear process to use (second harmonic generation, third harmonic generation, etc.). Note that not all processes are compatible with all methods. See Available methods for a full list.
- The next available option is the definition of the parameter that is scanned during the measurement. It depends on the chosen method.
FROG, IFROG, TDP: The parameter is the delay in fs. It is taken to be the same as the temporal axis on which the pulse is defined.
- MIIPS: The parameter is the delta of the phase pattern.
Alpha (rad):
(type: float)AmplitudeGamma (Hz):
(type: float)FrequencyMIIPS Parameter Scan:
(type: group)Phase minimum, maximum, and step size, in rad.
DSCAN: The parameter is the amount of material inserted in mm.Unfortunately, the DSCAN method has been removed from the public version of this code due to legal threats from a patent holder.
Material:
(type: list)Material inserted. Currently, only Fused Silica (FS) and BK7 are implemented.Dscan Parameter Scan:
(type: group)Insertion minimum, maximum, and step size, in mm.
- Grid settings:
lambda0 (nm):
(type: float)Central wavelength of the spectral axis.Npoints:
(type: list)Number of points of the spectral axis.Time resolution (fs):
(type: float)Time between two points in the temporal axis. Determines the temporal resolution, and also sets the span of the spectral axis.
- Plot settings:
Units:
(type: list, values: nm or Hz)Unit for spectral axis: wavelength in nanometers, or angular frequency in Hz.Autolimits?:
(type: bool)When toggled, automatically restricts the limits of the trace plot to match the data.Autolimits Threshold:
(type: float)Threshold for the autolimits: 0.01 means that we show the region where the trace is above 1% of its maximum value.Set Limits?:
(type: bool)When toggled, the user can choose limits in the spectral domain.Npts:
(type: list)Number of points in the spectral domain for the trace plot.